We aimed to achieve an isotropic resolution <1 µm to image submicron structures in large, cleared samples in various media. Hence, the DL needed to have an NA of ≥0.4. Commercially available options included a multi-immersion lens (×16, NA 0.4, working distance around 12 mm, ASI), which achieves optimal sampling when paired with a 200 mm tube lens and an sCMOS camera with a typical pixel pitch of 6.5 μm (Supplementary Note 1 and Supplementary Fig. 1). This lens is already corrected for chromatic aberrations with constant working distance for different RIs, compatible with various media without the need to realign the lens when changing the medium, making it the ideal choice for the detection lens in our setup.
Conversely, an air objective lens with matching NA = 0.4 served as an ideal illumination lens. We placed it outside the interchangeable sample chamber and its toxic solvents. The air lens can be moved freely during alignment without requiring any sealing. The flexibility of the air illumination objective lens also enabled us to attach the detection lens in a fixed position, sealed to the chamber with a simple O-ring, and its focal plane in the chamber center aligned to the illumination’s optical axis. The illumination lens’ large working distance (20 mm in air) is beneficial for imaging large samples of a centimeter or more. The chosen Mitutoyo objective lens (×20 plan apochromat) has an NA of 0.42, which closely matches the detection lens’ NA—a prerequisite for achieving isotropic resolution. In addition, in ASLM, to minimize aberrations, the remote-focusing objective lens should ideally be identical to the illumination lens, which was easily achievable with this affordable, long working distance, air objective lens.
Our microscope consists of four main optical components: the laser launch, the ASLM, the illumination arm and the detection arm (Fig. 1a,b, Supplementary Figs. 2–3 and Supplementary Table 2). Briefly, a laser beam with a Gaussian profile enters through the laser launch and is shaped into a light sheet using a cylindrical lens (CL). This light sheet then travels to the ASLM unit, where it is swept by a voice coil and its attached mirror, positioned opposite the ASLM objective lens. The voice coil acts as a single-axis translator, moving rapidly the mirror along the optical axis. Reflecting the primary light sheet through the ASLM and illumination arm results in a shifted light sheet within the chamber. The DL then collects the fluorescence emitted from the sample, and the image is formed by a tube lens on an sCMOS camera with a rolling shutter (Methods).
a, Optical schematic of the cleared tissue setup from a top view. b, 3D rendering of the optical setup in a. c, Comparison of a glass window and a meniscus lens for correcting spherical aberration in the illumination beam. d, Single static beam in a chamber with a flat window and a meniscus lens. The graph shows the beam thickness for both cases. The images are examples from one of ten imaged beams. e, Schematic of the voice coil when its input voltage is changed stepwise. Second and third panels: recorded single beam across the detection FOV, demonstrating the absence of aberrations. f, Swept beam with the continuous motion of the voice coil synchronized with the sCMOS rolling shutter. The images are examples from one of five imaged beams. AOL, ASLM objective lens; IL, illumination objective lens; DL, detection objective lens; TL, tube lens; EF, emission filter; FWHM, full-width at half-maximum; PBS, polarizing beam splitter; QWP, quarter-wave plate.
When using an air objective lens, one of the primary aberrations anticipated is spherical aberration, which prevents the light sheet from achieving the diffraction limit23 (Fig. 1c, first row). To mitigate spherical aberrations, we introduced an off-the-shelf meniscus lens between the air objective lens and the chamber instead of using a flat glass window. The meniscus lens has a curvature that matches the NA of the illumination beam to allow all the rays to enter the chamber perpendicular to the glass surface and to minimize refraction (Fig. 1c, second row). Comparing the beam quality, we saw strong spherical aberration when using the flat glass window, whereas it was eliminated greatly with the meniscus lens, reducing the beam size from 2.1 μm to 900 nm, the near-diffraction limit (Fig. 1d). We also examined the beam quality across the detection FOV to ensure it remained aberration-corrected when sweeping the light sheet. We achieved a homogeneous, confined beam across the entire FOV (800 μm × 800 μm) by combining ASLM with the meniscus lens. We then synchronized the swept aberration-corrected beam with the sCMOS rolling shutter during the exposure time, recording it over the FOV from left to right (Fig. 1f and Supplementary Video 2).
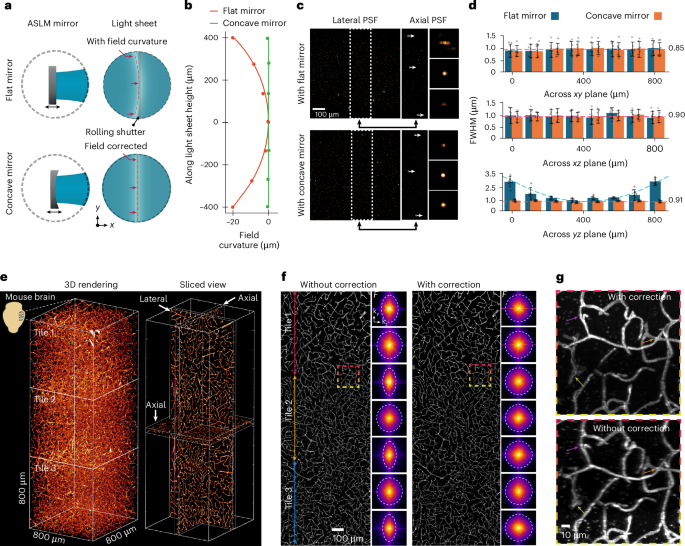
Another essential requirement for ASLM is that the waist of the light sheet forms a straight line from top to bottom across the FOV. This is necessary to synchronize the thinnest part of the sweeping light sheet with the center of the rolling shutter. However, illumination field curvature is expected when using a high NA air objective lens in combination with high RI medium across a large FOV (Fig. 2a). To evaluate the illumination field curvature, we first imaged the light-sheet profile directly using a small mirror inside the chamber at 45 degrees between the optical arms. We then measured the center location of the light-sheet cross-section from top to bottom (Methods). The field curvature of the light sheet was 20 ± 0.2 μm with an excitation beam of 561 nm and RI of 1.56, which was nearly three times larger than the light-sheet Rayleigh length (Fig. 2b, red line). To correct the light-sheet field curvature, we explored replacing the conventional flat mirror in the ASLM unit with a concave mirror with an inverse curvature, as measured by the light-sheet field curvature. The chosen off-the-shelf concave mirror (CM127-010-P01, Thorlabs) has a 9.5-mm effective focal length with a maximum offset of 10 μm at 400 μm from its center, which covers the light sheet with an 800-μm height (Supplementary Fig. 4a). The field curvature was corrected to less than 1 μm along the light sheet (Fig. 2b, green line) compared to the flat mirror. Then, we characterized the axial resolution by imaging 200 nm nanoparticles and measuring the point spread function (PSF). When using the flat mirror, we measured a variety of axial PSFs over the light-sheet height from 800 nm to 2.5 μm (Fig. 2c). Here we achieved isotropic resolution only in the central 400 µm of the FOV, whereas the rest of the FOV remained nonisotropic. However, with the concave mirror, the axial resolution was homogeneous across the entire FOV, with an isotropic resolution of 850 nm. This enabled us to increase the effective FOV by a factor of two compared to the flat mirror (Fig. 2d).
a, Schematic comparison of using the flat mirror and curved mirror in the ASLM unit and their effect on the field curvature of the light sheet. b, Measured field curvature of the light sheet without (red) and with correction (green). c,d, PSF measurement with 200-nm nanoparticles and comparison without and with the field curvature correction in lateral and axial directions. The PSF FWHM (± s.e.m.) was measured for seven beads in each FOV section. e, 3D rendering and middle slices of the lateral and axial views of the recorded data from a cleared mouse brain, stained for microvessels with three tiles along the height of the light sheet. The images are examples from one of three imaged mouse brains. f, Axial view of the recorded data in d along the light-sheet height and the corresponding Fourier domain comparison with its associated cut of frequency for seven regions. g, Enlarged view of selected areas in f located between adjacent tiles. The arrowheads show the improvements in vessel information with field curvature correction.
To examine the microscope’s performance in cleared tissue, we used a mouse brain labeled with antibodies for brain endothelial cells, visualizing even the smallest vascular structures, so-called capillaries (Fig. 2e). The imaging was done for three tiles to evaluate the resolution across the volume, before and after field curvature correction (Fig. 2f). The axial view of the recorded images before field curvature correction showed that the cut-off frequency of the noncorrected images varied and decreased to almost half in the Fourier domain compared to the image with corrected field curvature. In contrast, image quality and the frequency distribution remained constant across the tiles when imaged with field curvature correction (Fig. 2g). Consequently, eliminating the light-sheet field curvature achieved isotropic resolution across a larger FOV and into the corners of the images, crucial for image stitching and quantitative imaging.
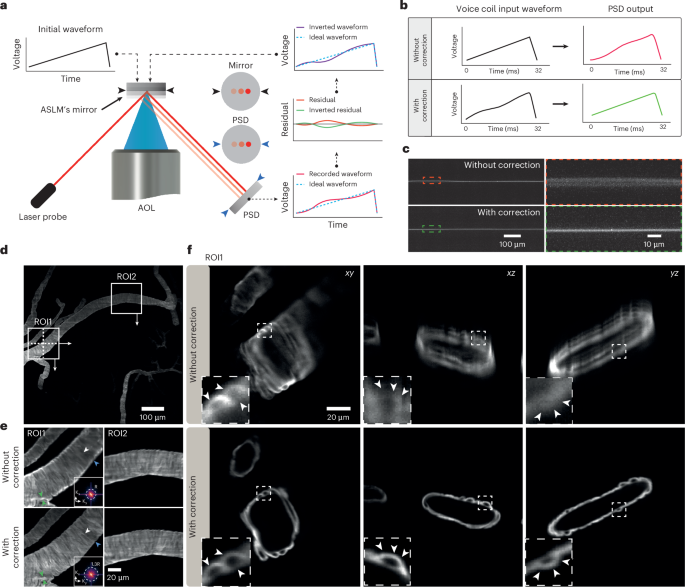
Alongside spatial resolution, imaging speed is also important for achieving high-throughput imaging of large samples. In ASLM, the maximum speed is determined mainly by the sweeping device, which in our case is a voice coil with a reported speed of up to only 10 Hz for ASLM13. To explore the voice coil’s potential to move much faster, we developed a small, closed-loop monitoring arm with a low-power diode laser and a position-sensing detector (PSD; Fig. 3a). The axial movement of the voice coil translated into a lateral shift of the reflected laser on the PSD and a modulation of its voltage output (Methods). Our measurements across typical exposure times from 8 ms to 256 ms confirmed that the voice coil’s response was not uniformly linear across all frequencies, particularly at higher frequencies, which desynchronized the movement of the light sheet and the rolling shutter at several parts of the FOV (Supplementary Fig. 5). To eliminate the nonuniformity, a correction waveform was calculated based on the residual of the voice coil’s response to the initial sawtooth waveform, which was then applied back on the voice coil as a correction waveform. Notably, even after just a few iteration cycles, the voice coil’s movement became uniformly linear, allowing for precise synchronization between the sweeping light sheet and the sCMOS rolling shutter at almost full speed without compromising FOV coverage (Fig. 3b,c). This approach also allowed us to synchronize the voice coil with the rolling shutter at a frame rate of 100 frames per second (fps) (Supplementary Table 1).
a, Schematic of the PSD arrangement and the closed-loop control of the voice coil in the ASLM unit, along with the adaptive algorithm for correcting voice coil movement. PSD indicates the position-sensing device. b, Recorded feedback waveform from the PSD without and with correction at voice coil frequency 31 Hz. c, Recorded swept beam inside the chamber corresponding to the waveforms in b with an exposure time of 25 ms. d, Recorded mouse brain stained for αSMA, showing a selected ROI with and without waveform correction. e, Selected ROI1 and ROI2 in d. Resolution analysis in the Fourier domain shows an increase in resolution after voice coil correction. f, Cross-section of ROI1 from d in the xy, xz and yz planes with and without voice coil movement correction. The subsets and arrowheads highlight the same area. The images in d–f are examples from one of four sampled images.
We next tested the system’s performance for high spatiotemporal resolution imaging of a piece of cleared mouse brain (800 μm × 800 μm × 2,400 μm) with fluorescently labeled larger vessels, especially arteries and arterioles, using an antibody detecting smooth muscle cells (α-smooth muscle actin, αSMA; Fig. 3d). Here, the imaging was done with an sCMOS camera with a controllable rolling shutter at its maximum frame rate (PCO Panda; Supplementary Table 1). The recorded data showed a resolution variation across the FOV and along the sweeping light sheet in both lateral and axial views before the voice coil waveform correction. Notably, the isotropic resolution across the entire FOV was achieved only with the corrected waveform of the voice coil. Individual fine vasculature structures were resolved in all directions at submicron scale at 40 Hz across the entire FOV (Fig. 3e,f).
Benchmarking the light-sheet system by imaging cleared specimens at different RIs
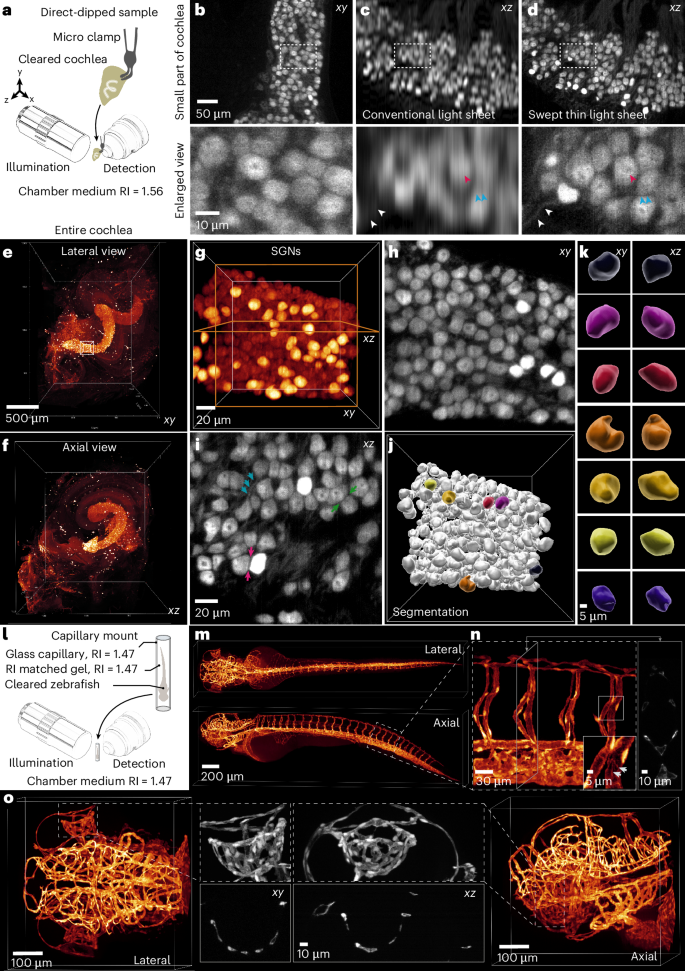
To benchmark the microscope’s performance for rapid and isotropic imaging of whole cleared organ samples, we first imaged an entire mouse cochlea. The cochlea offers an intricate snail-shaped three-dimensional (3D) structure with the spiral ganglion sampling sound information along the frequency axis. iDisco cleared mouse cochlea10 (Methods) were matched with an RI of 1.56 (ECi; Fig. 4a). Immunolabeling with parvalbumin (PV) allows for robust visualization of the entire population of spiral ganglion neurons (SGNs) within the Rosenthal canal. We first imaged a small part of the cochlea to see how much more information can be retrieved along the axial direction when using a thin swept light sheet compared to a conventional light sheet with a thickness of about 5 μm covering the entire FOV: detailed observation, especially in the axial direction, had hitherto remained elusive when using conventional light-sheet methods (Fig. 4b–d). The typical volume of a cochlea is approximately 1.5 mm × 1.5 mm × 2 mm (Fig. 4e,f) and could be imaged in four tiles. We employed a plane spacing of 380 nm, consistent with the pixel size, for an RI of 1.56 to achieve a resolution of 850 nm. Up to 4,000 imaging planes were needed in each tile to cover the entire volume. Because of the isotropic resolution, each SGN was clearly distinguished from its neighbors, and neurites were detected (Fig. 4g–i), enabling us to segment each SGN properly (Fig. 4j,k). Alongside submicron isotropic resolution, our microscope allowed us to image a mouse cochlea with four tiles in just 2.1 to 8.5 min at an exposure time of just 8–32 ms, respectively (Supplementary Video 3).
a, Schematic of the cochlea and its mounting in the microscope. b, Top: recorded data from a small section of an anti-PV-stained cochlea with a swept thin light sheet. Bottom: selected and magnified ROI from the top row. The image is an example from one of two imaged samples. c, Top: reconstructed axial image in b recorded with a conventional light sheet covering the entire FOV. Bottom: selected and magnified ROI from the top row. d, Top: reconstructed axial image in b recorded with a swept thin light sheet. Bottom: selected and magnified ROI from the top row. All arrows of the same color indicate comparisons between the magnified images in c and d. e, 3D reconstruction of a mouse cochlea from four tiles (lateral view). The image is an example from one of five imaged samples. f, 3D reconstruction of e (axial view). g, An ROI in the cochlea base with SGNs from e. h,i, Lateral (h) and axial (i) view of the midplane in g. Blue arrows mark exemplary neurites of the bipolar SGNs. The green and red arrowheads indicate the well-resolved gap between the neurons due to the isotropic resolution. j, 3D rendering after segmentation in g. k, Selected segmented SGNs in j (lateral and axial view), labeled with a unique color for each SGN. l, Schematic of the zebrafish and its mounting in the microscope using a borosilicate glass capillary. m, 3D reconstruction of the zebrafish from both lateral and axial views. The image is an example from one of four imaged samples. n, Enlarged view of a selected ROI in the tail; the inset highlights magnified vessels within this ROI. All arrows indicate the endothelial cell boundaries. The right panel displays a cross-section of the tail. o, Enlarged views of the zebrafish head from m, including lateral and axial views (first and last). The middle images represent maximum intensity projections of the vasculature around the eye in both orientations, along with a central cross-section.
To evaluate the microscope’s performance at different RIs, we cleared a 3 days postfertilization (dpf) Tg(kdrl:GFP) zebrafish using an adjusted version of the EZ Clear protocol20 (Methods). The zebrafish was mounted in an RI-matched agarose gel (RI = 1.47) inside a borosilicate glass capillary suspended in glycerol (Fig. 4l). This mounting method allows for easy mounting of delicate or fragile samples while maintaining a uniform RI (Methods). The sample was imaged in four tiles, totaling 8,000 planes for the entire sample, with a plane spacing of 390 nm. The entire sample is recorded with 100 fps within an acquisition time of 1 min and 20 s (Fig. 4m–o). The data showed consistent image quality in both lateral and axial views, with fine details such as endothelial cell boundaries clearly resolved in all directions (inset; Fig. 4n). Isotropic resolution was confirmed by examining the delicate ophthalmic vasculature in both lateral and axial views, which showed equally well-resolved vascular walls and lumina (Fig. 4o and Supplementary Video 4).
Isotropic 3D imaging enables analysis of cochlear connectomics
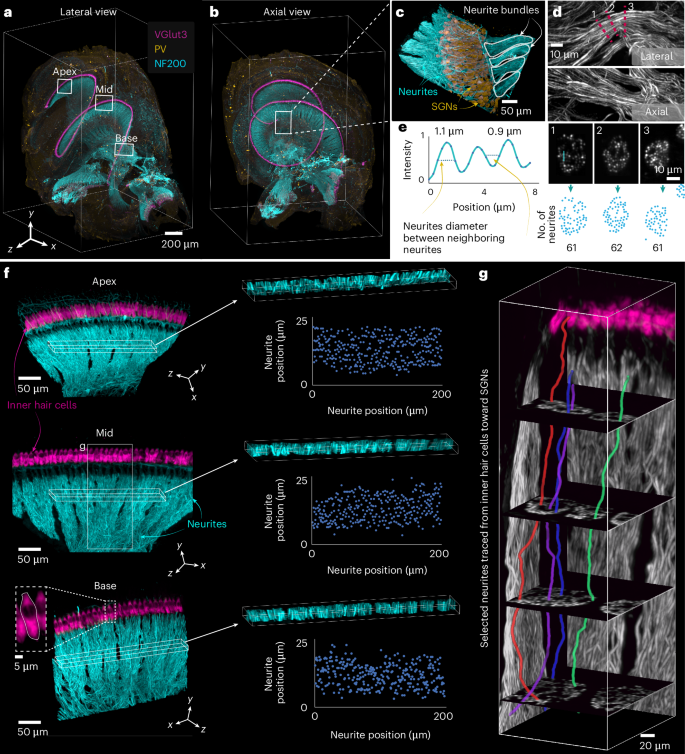
To demonstrate the biological applicability and resolution performance of our light-sheet microscope in structured and functionally critical tissue, we performed high-resolution imaging of cochlear afferent innervation. Using triple-color fluorescent labeling, we visualized inner hair cells (IHCs), SGNs and their peripheral neurites (Fig. 5a,b). Imaging was carried out at the system’s maximum isotropic resolution, enabling a comprehensive 3D reconstruction of cochlear architecture with consistent detail across all spatial orientations. We first rendered whole-organ 3D overviews with clearly separated channels, followed by the selection of a region of interest (ROI) from the basal turn encompassing SGNs and their neurites (Fig. 5c–e and Supplementary Video 5). Within this ROI, we extracted three cross-sectional planes perpendicular to the local neurite trajectory at distinct locations along the cochlear spiral. In these planes, individual neurites could be resolved and counted, indicating that fine anatomical structures remained sharply defined regardless of orientation. This underscores the system’s isotropic resolution and its suitability for neuroanatomical quantification.
a,b, Lateral (a) and axial (b) views of a full cochlea volume showing IHCs immunolabeled for VGlut3, SGNs labeled with anti-PV and neurites labeled with NF200 in x, y and z. The image is an example from one of three imaged samples. c, Selected and magnified ROI from b, showing neurites and SGNs (left) and neurites in lateral and axial views (right). d, Analysis of a single neurite bundle in c. First row: lateral view; second row: axial view; third row: neurite diameter and position in three oblique planes along the neurite extension marked with a red dashed line and numbered 1, 2, 3; fourth row: neurite count from exemplary cross-sections shown in d, first row. e, Line profile of three neighboring neurites in cross-section 3 in d. f, Selected ROIs from the apical, middle and basal turns of the cochlea, as shown in a, depicting IHCs labeled with VGlut3 and neurites labeled with NF200 to visualize neurite positions for exemplary counting across all cochlear turns. g, Tracing SGN neurites from the organ of Corti to the spiral ganglion in an ROI from the midturn of the cochlea, shown in d.
To expand the analysis, we selected three larger ROIs from the apical, middle and basal turns. In each, we quantified the number of SGN neurites terminating on 25 adjacent IHCs—a direct proxy for IHC–SGN connectivity, which is critical for understanding auditory function and pathology (Fig. 5f). The ability to perform these counts across the cochlea consistently reflects the uniform image quality, enabling comparative assessments of innervation density and spatial patterning along the tonotopic axis.
We then traced and segmented selected neurites from their synaptic connection with IHCs to the corresponding SGN soma within the Rosenthal’s canal, capturing their full 3D trajectories (Fig. 5g). This level of structural detail supports studies of cochlear neuronal connectivity, allowing reconstruction and analysis of afferent pathways at the single-cell level. Such detailed mapping opens the door to systematic studies of cochlear connectomics, including afferent synaptic organization of type I and II SGNs, molecularly defined type I SGN subtypes29,30,31, efferent connectivity, and circuit-level remodeling in health and disease.
Imaging of the whole mouse brain
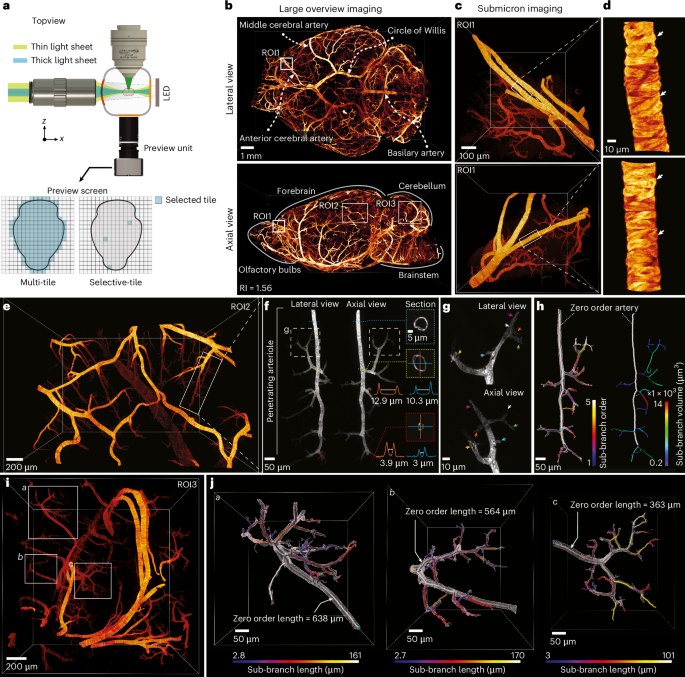
To assess the system’s performance in imaging even larger specimens, we imaged an entire mouse brain (14 mm × 10 mm × 7 mm) immunolabeled for arteries and arterioles by αSMA-targeting antibodies (Supplementary Fig. 6; Methods). A compact preview system with a ×0.3 optical magnification was installed opposite the detection lens, providing a large overview of approximately 15 mm × 15 mm (Fig. 6a). The preview assists the user in choosing the desired orientation and selecting several tiles across the entire sample, each covering a full detection FOV of 800 μm × 800 μm.
a, Schematic of the setup with chamber, lenses and a small camera unit for capturing a preview image of a large sample and selecting the tiles. b, Entire reconstructed mouse brain from lateral and axial views. The image is an example from one of two imaged samples. c, Re-imaged selected ROI in b and the reconstructed axial view (second row). d, Enlarged view of selected small vessel in c (first row) and reconstructed axial view (second row), highlighting individual vessel cells (arrowheads). e, Selected ROI2 from the cortex in b, which was recorded with the highest possible isotropic resolution. The image is an example from one of two imaged samples. f, Selected penetrating arterier and cross-sections at different depths and branches. The vertical line (orange solid line) and horizontal line (blue solid line) profiles indicate the measured line profiles from the cross-sections of the zero-order artery and the last SMA-positive termini. The inner distance between the artery walls was measured and indicated with a white double arrowhead line. g, Enlarged view of one of the penetrating subarteries in f. The color-coded arrowheads indicate the last SMA-positive arterial termini with the same color from both lateral and axial views. h, Left: segmentation of the entire penetrating artery and the counted sub-branches until the last SMA-positive termini. Right, the calculated volume of the main and subarteries. i, Selected ROI3 from the cerebellum in b, which was recorded with the highest possible isotropic resolution. The image is an example from one of two imaged samples. j, Full segmentation of three selected penetrating arteries named a, b and c. The segmentation and artery tracing enabled us to find the length of the main and subarteries in all directions.
We first acquired a quick overview of the mouse brain by selecting all the tiles covering the brain and imaging them with a thick light sheet (3.8 μm). This reduction in axial resolution is achieved quickly by limiting the NA of the illumination beam with an adjustable slit. To achieve an isotropic overview, the pixel size of the recorded image was then matched to the light-sheet thickness by a binning of ten. The entire mouse brain was recorded and reconstructed at this resolution in less than 30 min. The reconstructed data enabled us to identify the entire brain’s vasculature trees, including the main arteries located at the surface as well as deeper arterioles (Fig. 6b). To observe the vessels’ subcellular structure, we identified ROIs, for example, part of the anterior cerebral artery, and re-imaged the related selected tile volume (800 μm × 800 μm × 800 μm) again at the highest possible isotropic resolution (850 nm), which only took about 21 s for 2,100 layers (Fig. 6c). The raw data provided isotropic subcellular information of individual smooth muscle cells viewed from any angle without deconvolution or other processing (Fig. 6d and Supplementary Video 6).
To further benchmark the biological relevance and resolution fidelity of the system, we imaged two distinct parts of the mouse brain, targeting anatomically and functionally different regions: the cerebral cortex and the cerebellum. Imaging was carried out at the maximum achievable resolution, allowing us to visualize fine vascular structures throughout the entire volume without compromising depth or FOV. In each region, we isolated and analyzed three individual penetrating arteries, each differing in depth and spatial orientation. We were able to accurately measure vessel diameter along their full trajectories, regardless of spatial orientation or local deformation—demonstrating the system’s ability to maintain uniform, isotropic resolution. This overcomes a main limitation of conventional LSFM systems, which often suffer from degraded axial resolution (Fig. 6e,f).
Using 3D segmentation and skeletonization, we reconstructed the full branching architecture of each vessel down to the last SMA-positive termini (Fig. 6g). Precise illustration of the arteriolar-capillary transition zone allowed for clear distinction of different types of mural cells without additional markers or tissue cutting. The ring-like morphology of smooth muscle cells in the arterioles was replaced by an enwrapping morphology in higher-order vessels, reflecting ensheathing pericytes32. Notably, mural cells in higher-order branches appeared less intense, suggesting a reduced expression of αSMA in those cells. The full reconstruction enabled precise quantification of branch number, length and morphology (Fig. 6h and Supplementary Fig. 7), supporting applications that rely on high-fidelity structural analysis, such as vascular remodeling, angiogenesis during development or vascular remodeling after ischemic insults.
In the cerebellum, vascular features—including the lengths of penetrating arterioles, branching patterns and compact geometries—were also readily recorded. These characteristics, which differ from those in the cortex and reflect the anatomical and functional distinctions of this brain region, were visualized without the need for angle-specific imaging, highlighting the versatility and consistency of our system (Fig. 6i,j).
Overall, this analysis highlights how our microscope enables orientation-independent, subcellular-resolution imaging across large tissue volumes. The ability to accurately trace and quantify individual vessels in three dimensions, regardless of geometry or orientation, makes it a powerful tool for investigating brain vasculature, microcirculation and disease-associated structural changes at unprecedented clarity and scale.


